Error budgeting your Spring Boot application with Actuator and Prometheus
Oleksandr Shynkariuk - Oct 30, 2023

Before we begin, let's first think what everything we do as software engineers is all about... User Happiness. A great new feature that you together with your team have been building in the last few sprints represents only a potential business value. Features and reliability are like Yin en Yang for User Happiness: the real value of the feature is not provided until successfully delivered to the end user. Unreliable feature will hurt a potential value of functionality. It may even detract users from using your product and make them go find an alternative solution on the market with better reliability.
Every successful product needs both Yin and Yang: features and reliability. The question is then: where should we put our efforts to have the right balance? As long as reliability is sufficient (within error budget), we can keep building features for our users. When it is insufficient, we need to take a time-out and understand what has to be improved and improve it.
User journey
User journey consists of the steps in a user workflow that user goes through to perform a task. For example, when user interacts with Spring PetClinic application, these could be some of the user journeys:
A user can view pet owners
A user can manage pet owners by adding new or updating existing ones
A user can register a pet by an existing pet owner
A user can create a vet visit for owner's pet
A user journey usually consists of a few steps involving multiple services. If at least one service in the chain performs unreliably, it will negatively impact the whole user journey.
Error budgeting with SLI/SLO
SLIs and SLOs define how we measure reliability (SLIs) and what is considered reliable (SLOs).
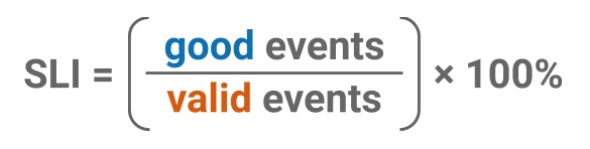
SLI is an indicator (metric) of reliability. One journey may have multiple SLIs. In general, it is measured as the proportion of valid events that are considered good:
Below are some SLI examples for different types of system aspects:
Request/Response
Quality: The proportion of valid requests served without degradation of service
Availability: The proportion of valid requests served successfully
Latency: The proportion of valid requests served faster than a threshold
Storage:
Throughput: The proportion of time where the storage reads/write rate was faster than a threshold
Latency: The proportion of storage read/writes that are finished faster than a threshold
Data processing
Throughput: The proportion of time where the data processing rate was faster than a threshold
Freshness: The proportion of valid data updated more recently than a threshold
Coverage: The proportion of valid data processed successfully
Correctness: The proportion of valid data that produced correct output
SLO is a target for SLI, measured over a time window. It is common to use a rolling 4 weeks (28 days) time window for it.
Once the SLIs/SLOs are defined and made measurable, the Error Budget can be defined as the gap between the SLO and 100%. For example, if SLO is 99%, the Error Budget would be: 100%-99% = 1%. Error Budgets allow teams to have some buffer that can be used for focusing on innovation.
Error budgeting in Spring boot
To set up error budgeting with Spring Boot Actuator and Prometheus we will use metrics exposed by Spring Boot Actuator. Prometheus will scrape these metrics and store them in a time-series database. Once you have these metrics, you can use them to create alerts when SLI/SLO goes over the error budget.
Start with adding necessary dependencies to pom.xml:
1
2
3
4
5
6<dependencies>
    <dependency>
        <groupId>org.springframework.boot</groupId>
        <artifactId>spring-boot-starter-actuator</artifactId>
    </dependency>
</dependencies>
Next, add the following configuration to your application.properties file:
1
2management.endpoints.web.exposure.include=*
management.metrics.export.prometheus.enabled=true
Make sure your prometheus instance is configured to scrape the application metrics, add this to prometheus.yaml:
1
2
3
4
5scrape_configs:
  - job_name: 'petclinic-app'
    metrics_path: '/actuator/prometheus'
    static_configs:
      - targets: ['localhost:8080']
Now let's add an alert for /owner endpoint when availability (SLI) is lower than 99% (SLO) in your prometheus.yaml file:
1
2
3
4
5
6
7
8
9
10
11groups:
  - name: PetClinic App
    rules:
      - alert: Availability is lower than 99% for listing pet owners operation
        expr: sum(rate(http_server_requests_seconds_count{job="petclinic-app", status!="200", uri="/owner"}[28d])) / sum(rate(http_server_requests_total{job="petclinic-app", uri="/owner"}[28d])) < 0.99
        for: 5m
        labels:
          severity: critical
        annotations:
          summary: "Availability degradation on {{ $labels.job }}"
          description: "More than 1% of requests are failing, which is more than the 28-day error budget."
And this is it! We went all the way from defining user journeys, discussing what is a difference between SLI and SLO, how they help define Error Budget, and finally we have set up a simple prometheus alert to get notified about possible reliability degradation in the future.