Configuring the ELK stack to persist your observability data from Jaeger
Adolfo Benedetti - Dec 12, 2022

...making sense of the observability(o11y) data
In this two part series of blogposts, we are going extend, integrate and analyse the data provided by CNCF OpenTelemetry Jaeger Distributed Tracing and persisted this data using the ELK stack. Having this, we will try to make sense of this collected data on our next Blogpost.
Jaeger is an open-source distributed tracing system created by Uber back in 2015, the jaeger client is now marked for deprecation in favor of OpenTelemetry Distro, therefore we will use the OpenTelemetry SDK, alongside a Jaeger exporter.
Elastic has his own observability platform already integrated in the stack: Elastic AMP. The major difference between Jaeger and Elastic APM is that Jaeger is designed specifically for distributed tracing, while Elastic APM is a more comprehensive performance monitoring tool. Distributed tracing is a technique used to track the movement of requests through a distributed system, allowing developers to understand the performance and behavior of their system at a granular level. Elastic APM, on the other hand, offers a wider range of features for monitoring the performance and behavior of applications, including support for a variety of programming languages and frameworks. The focus on distributed tracing is an increasingly important aspect of debugging modern applications whereas logging falls short.
Let's start deploying the Elasticsearch container. We are going to use Elastic 7.x branch because it contains the removal of mapping types, which is required for our kibana dashboards:
1
2
3
4
5
6
7podman | docker run --rm -it --name=elasticsearch \
  -e "ES_JAVA_OPTS=-Xms2g -Xmx2g" \
  -e "bootstrap.memory_lock=true" \
  -e "discovery.type=single-node" \
  -e "xpack.security.enabled=false" \
  -p 9200:9200 \
  -p 9300:9300 docker.elastic.co/elasticsearch/elasticsearch:7.17.6
Kibana is a popular open-source data visualization and exploration tool for Elasticsearch. It allows users to create and share dynamic dashboards for real-time analysis of data. Kibana provides powerful visualizations and tools for searching and exploring large datasets, making it an essential part of the Elastic Stack for data analysts and other users who need to quickly and easily understand and gain insights from their data. Let's deploy the Kibana container:
1
2
3
4podman | docker run --rm -it --link=elasticsearch --name=kibana \
  -e "KIBANA_JAVA_OPTS=-Xms512m -Xmx512m" \
  -e "XPACK_MONITORING_ENABLED=false" \
  -p 5601:5601 docker.elastic.co/kibana/kibana:7.17.6
Next, we deploy the Jaeger container, with a link to the Elasticsearch container –link=elasticsearch. The storage is defined as Elasticsearch type SPAN_STORAGE_TYPE=elasticsearch, and to store the Jaeger traces properly we need to set ES_TAGS_AS_FIELDS_ALL=true.
1
2
3
4
5
6
7
8
9
10podman | docker run --rm -it --link=elasticsearch --name=jaeger \
  -e SPAN_STORAGE_TYPE=elasticsearch \
  -e ES_SERVER_URLS=http://elasticsearch:9200 \
  -e ES_TAGS_AS_FIELDS_ALL=true \
  -p 5775:5775/udp \
  -p 6831:6831/udp \
  -p 6832:6832/udp \
  -p 5778:5778 \
  -p 16686:16686 \
  -p 14268:14268 jaegertracing/all-in-one:1.39.0
Modify the mapping of numeric fields in Jaeger
Currently, the fields indexed in Elasticsearch coming from Jaeger are indexed as keywords. That is fine when simple dashboards are required in kibana, but in order to make more powerful visualizations and/or perform calculations on them, we require those fields as numeric. We can achieve that by modifying The mapping definition of the Jaeger index. However, be careful with the order of this template and the order in which the Jaeger mapping is loaded. Also, be specific on the fields you need these mappings. For those you don't require as numeric you should leave them as keywords:
1
2
3
4
5
6
7
8
9
10
11
12
13
14
15
16
17
18
19
20
21
22
23
24
25
26
27
28
29
30
31
32
33curl --header "Content-Type: application/json" \
  --request POST \
  --data '{
  "order": 90,
  "index_patterns": [
    "*jaeger-span-*"
  ],
  "mappings": {
    "_doc": {
      "dynamic_templates": [
        {
          "span_long_no_index": {
            "match_mapping_type": "long",
            "mapping": {
              "type": "long",
              "index": false
            }
          }
        },
        {
          "span_double_no_index": {
            "match_mapping_type": "double",
            "mapping": {
              "type": "float",
              "index": false
            }
          }
        }
      ]
    }
  }
}' \
  http://localhost:9200/_template/custom-jaeger-span?include_type_name
With the command above we are sending a POST request to our Elasticsearch server. The request creates a new index template named custom-jaeger-span with the specified order: index_patterns and mappings values. The mappings value specifies that any fields of type long or double in documents that match the index_patterns should be treated as long or float fields, respectively, and should not be indexed. Index templates are used to define the settings, mappings, and aliases for indices that match the specified index_patterns, allowing users to define common settings and behavior for a group of indices.
Executing the command should give us the following repsonse:
1
2
3{
  "acknowledged": true
}
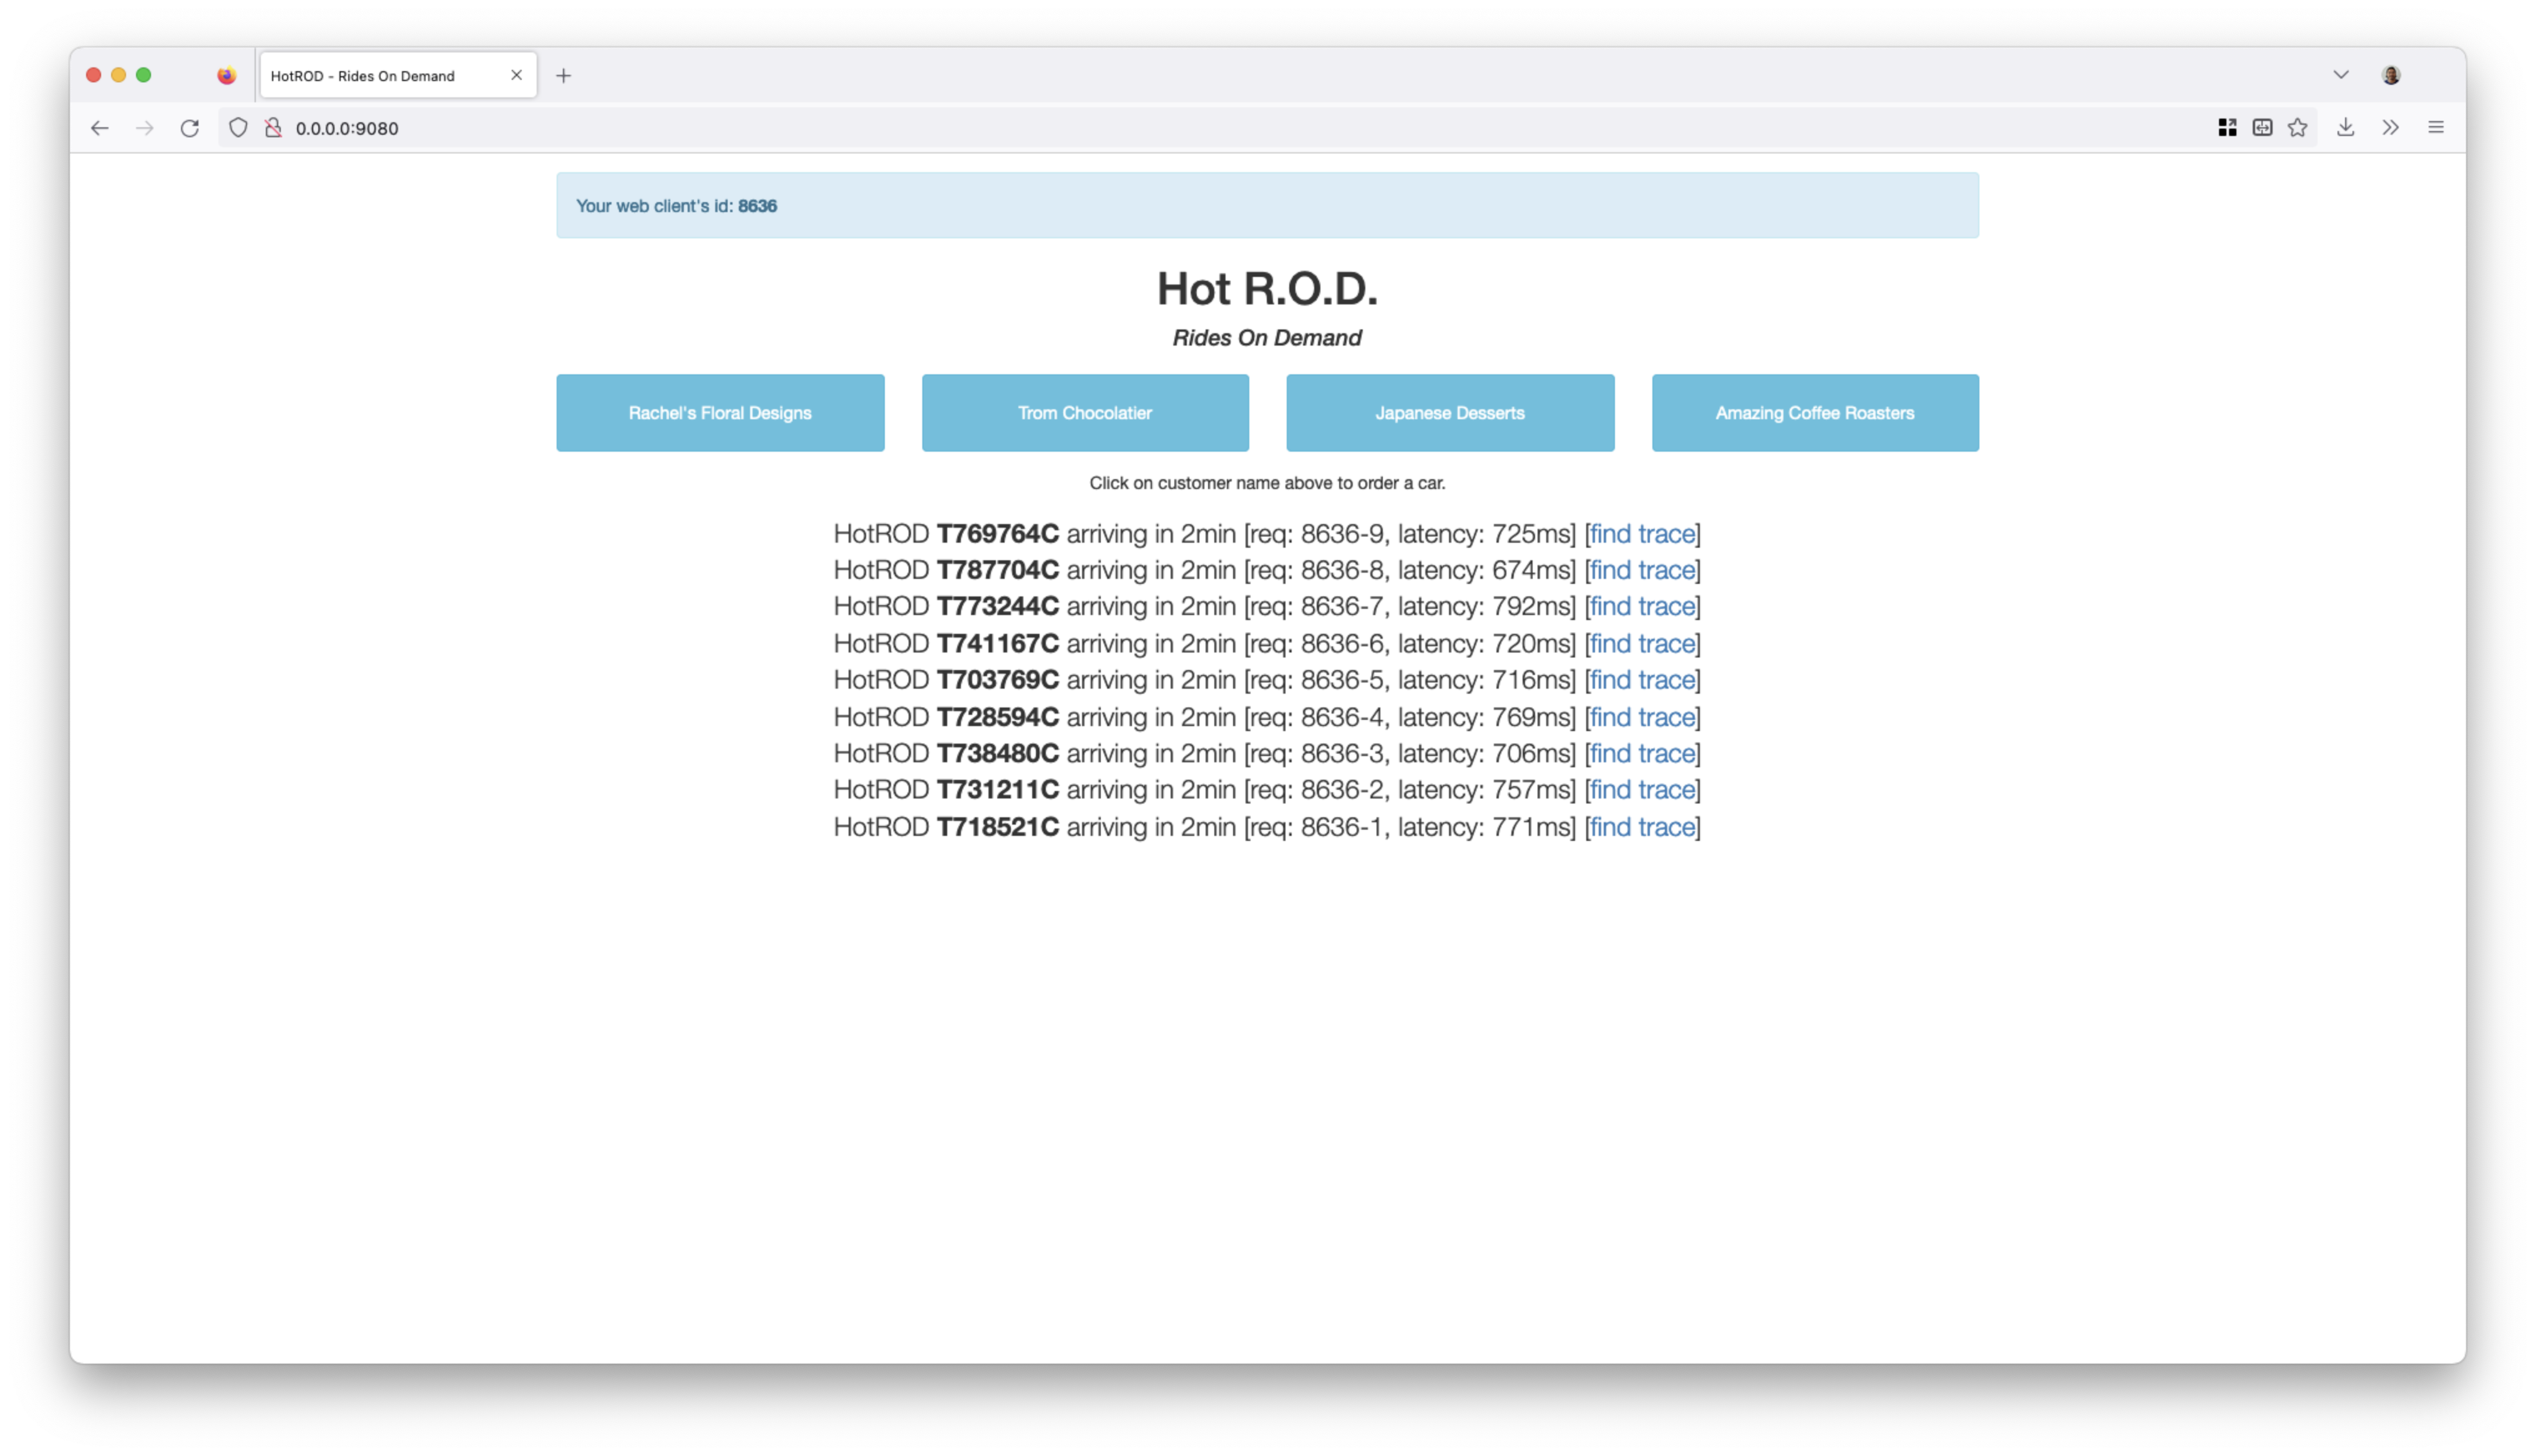
Let's verify the instrumentation with Jaeger's Hotrod (the instrumented sample jaeger application):
1
2
3
4podman | docker run --rm --link jaeger \
  -e JAEGER_AGENT_HOST=jaeger \
  -e JAEGER_AGENT_PORT=6831 \
  -p 9080-9083:8080-8083 jaegertracing/example-hotrod:1.39.0
And in your browser execute some requests. Now, we can the persisted traces of these requests in Elasticsearch.
To check the indexes in ElasticSearch we execute:
1curl -X GET "localhost:9200/_cat/indices?v"
1
2
3
4
5
6
7
8health status index                           uuid                   pri rep docs.count docs.deleted store.size pri.store.size
green  open   .geoip_databases                bmJOS-duStiVx5fyX_Vtnw   1   0         41            0       39mb           39mb
yellow open   jaeger-span-2022-10-31          WxyDJCS7ThCQaQVGMVbiBw   5   1       4948            0    834.1kb        834.1kb
yellow open   jaeger-service-2022-10-31       4rMZec6KScqgvrGxtAg4qA   5   1         22           19     57.4kb         57.4kb
green  open   .apm-custom-link                fcI7vhSSRyGO1h_JzKacEQ   1   0          0            0       226b           226b
green  open   .kibana_task_manager_7.17.6_001 oFHXX6RBQrSH4UizKqSB0g   1   0         17          621    164.7kb        164.7kb
green  open   .apm-agent-configuration        9Vq9XkeTS2mySnBqC0qQQw   1   0          0            0       226b           226b
green  open   .kibana_7.17.6_001              rYrcbcpOSPOOYizapkluLQ   1   0         15            0      2.3mb          2.3mb
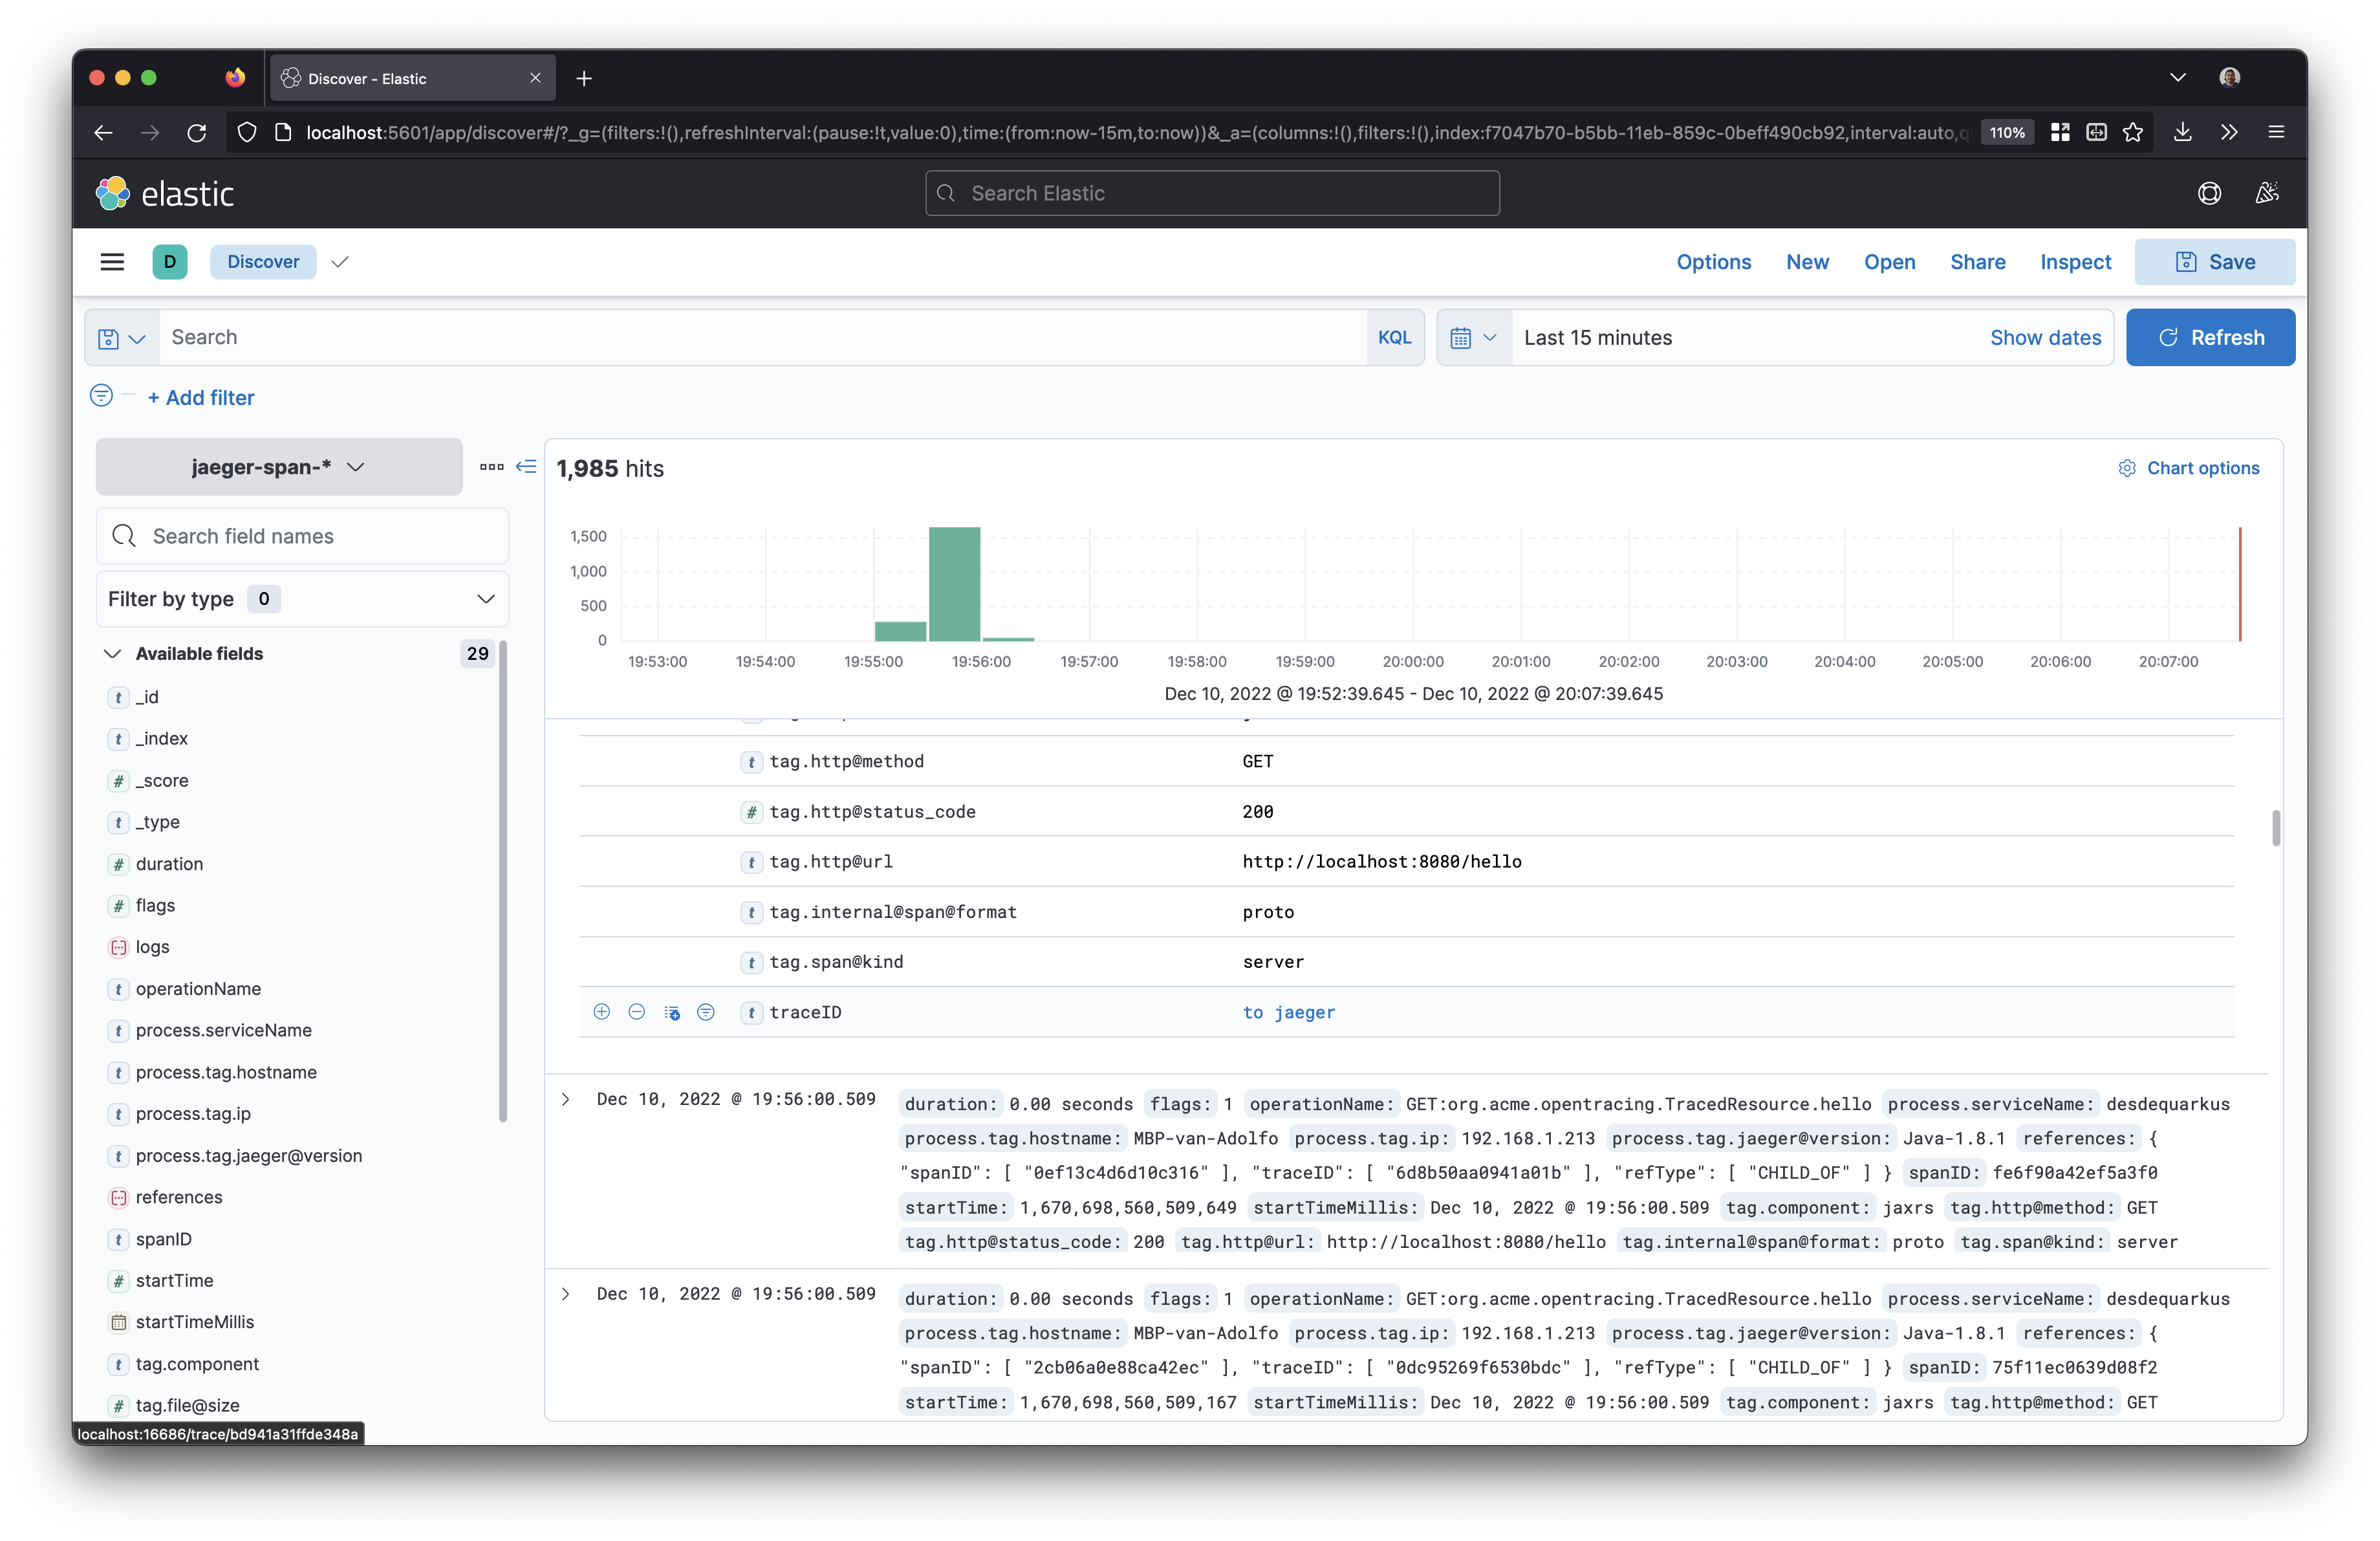
Our focus will be the jaeger indices with prefix jaeger-span-* for our kibana visualizations.
Next, we need check the mapping in jaeger:
1curl -X GET "localhost:9200/jaeger-span-*/_mapping" | jq
Also, we will check the mapping of one of the numeric fields of the instrumentation tags:
1curl -X GET "localhost:9200/jaeger-span-*/_mapping/field/tag.http@status_code" | jq
1
2
3
4
5
6
7
8
9
10
11
12
13
14
15
16{
  "jaeger-span-2022-10-31": {
    "mappings": {
      "tag.http@status_code": {
        "full_name": "tag.http@status_code",
        "mapping": {
          "http@status_code": {
            "type": "long",
            "index": false
          }
        }
      }
    }
  }
}
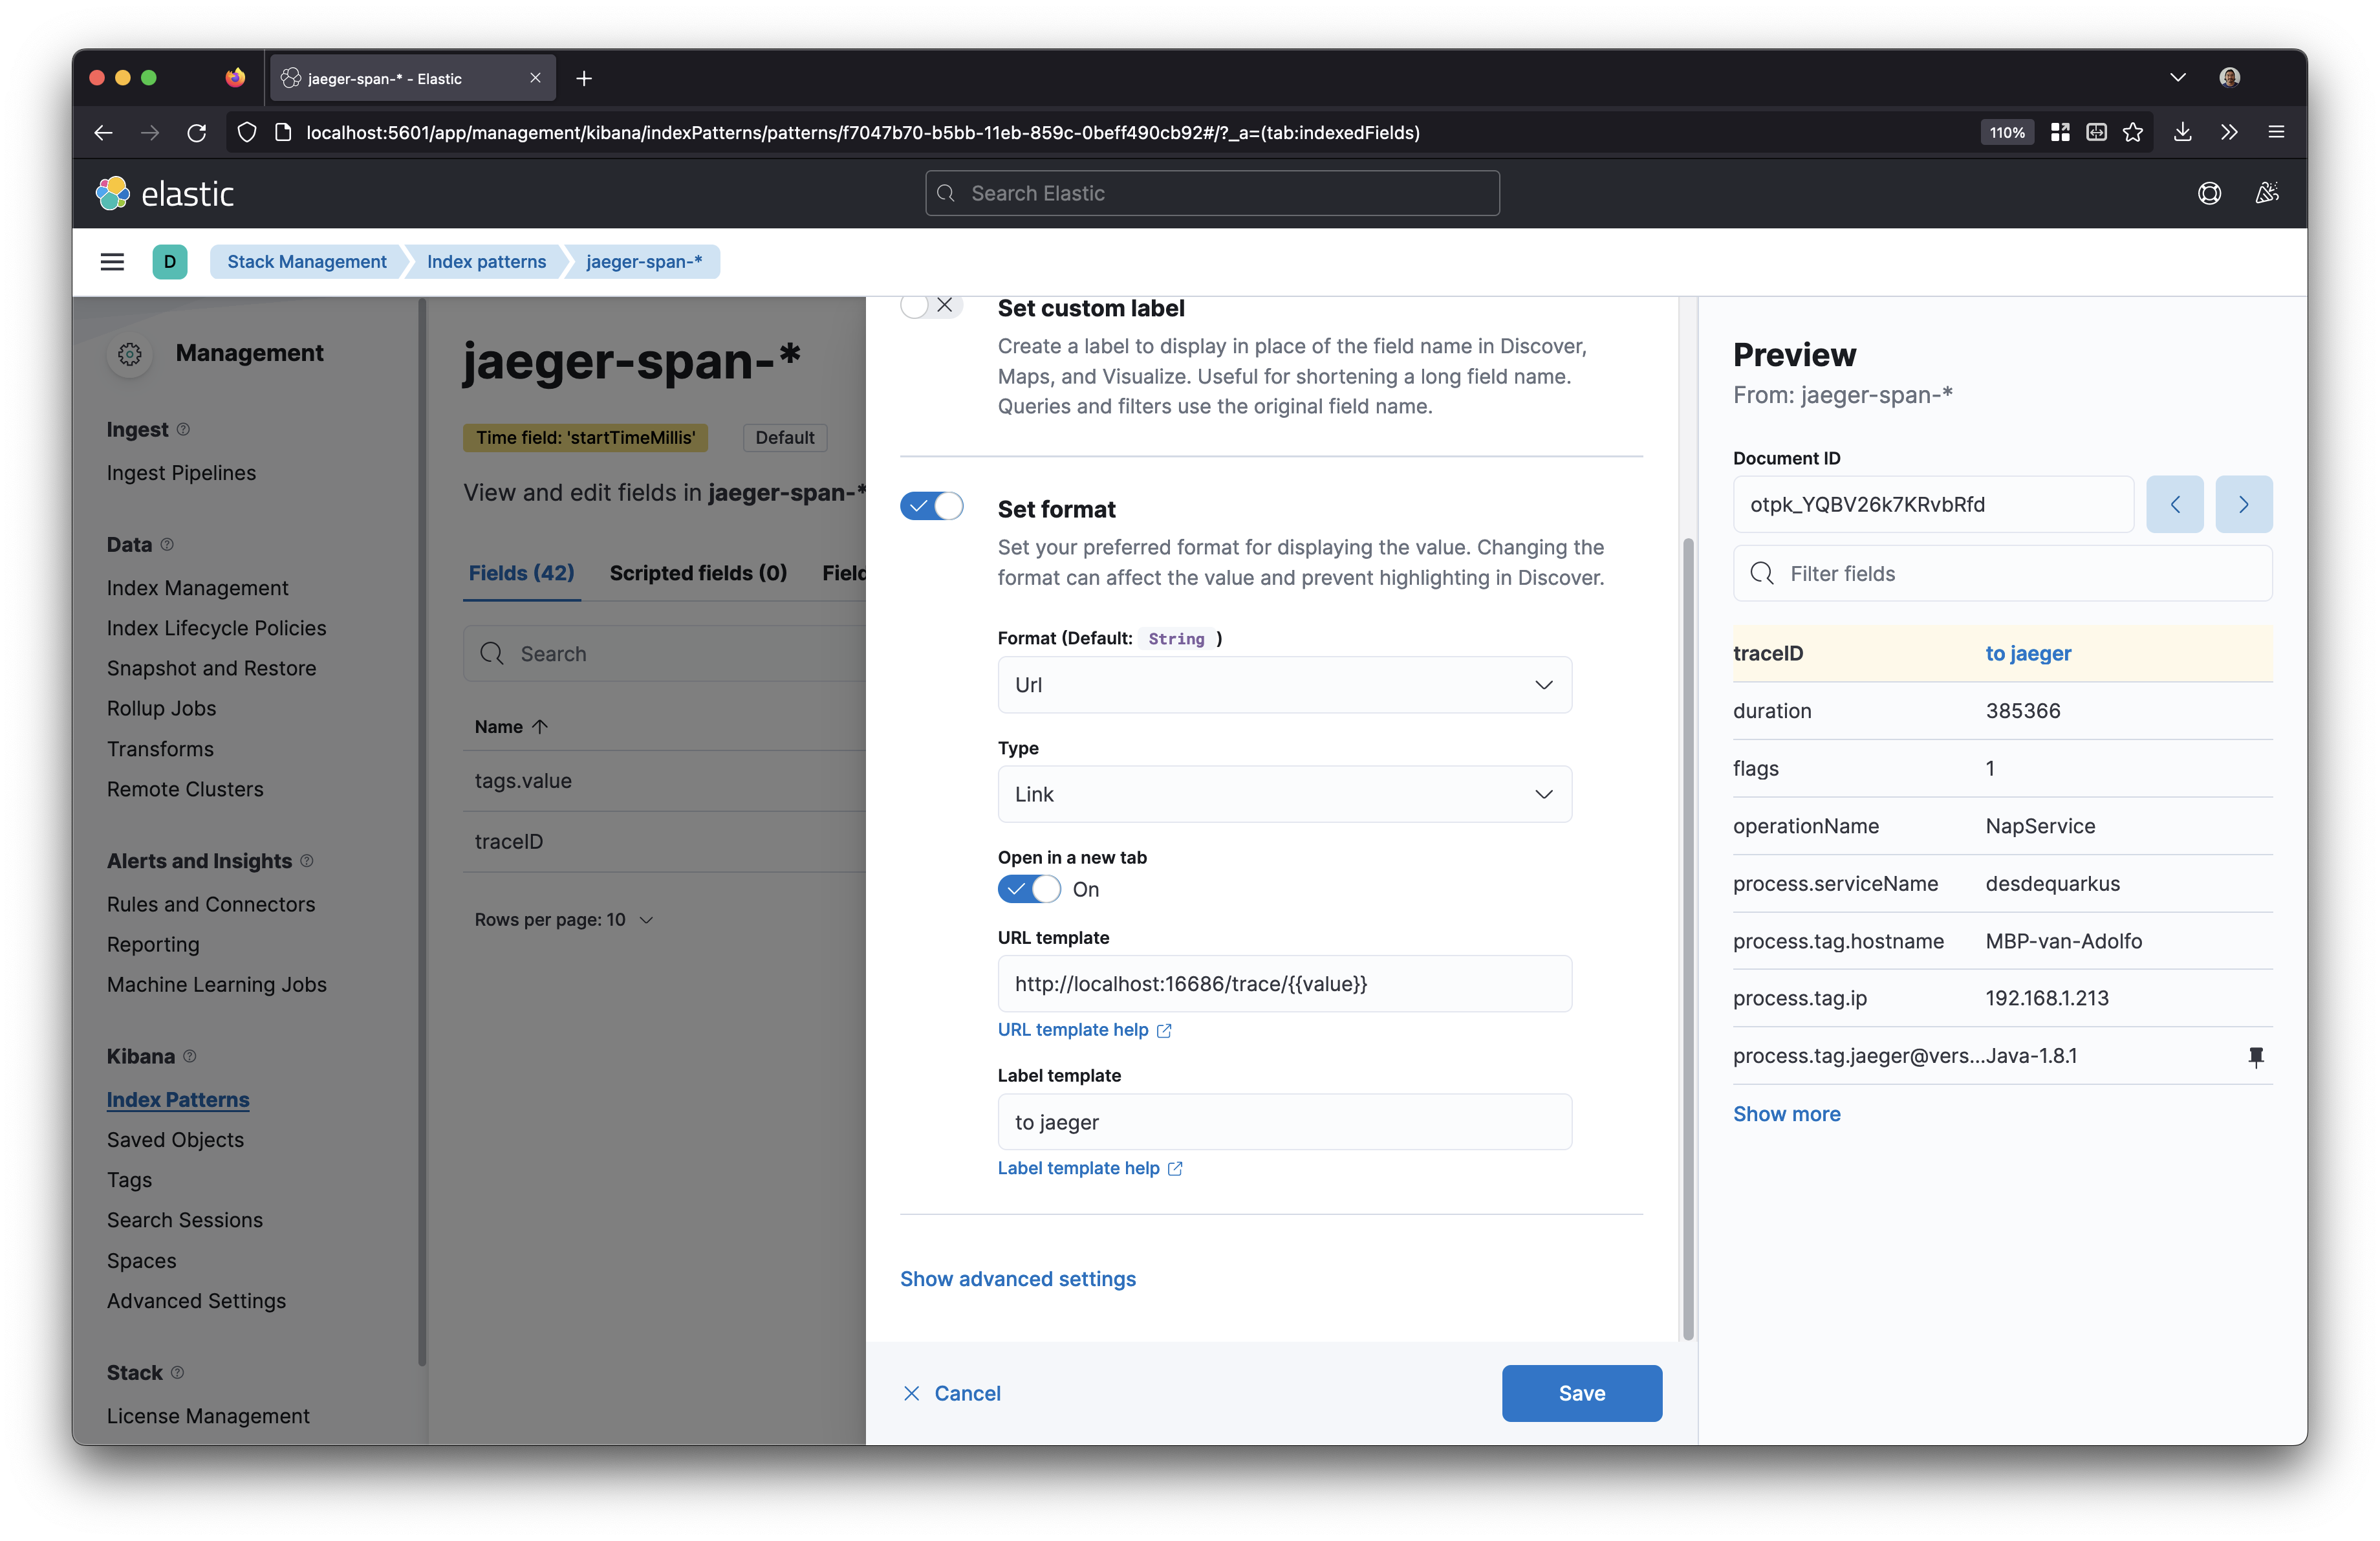
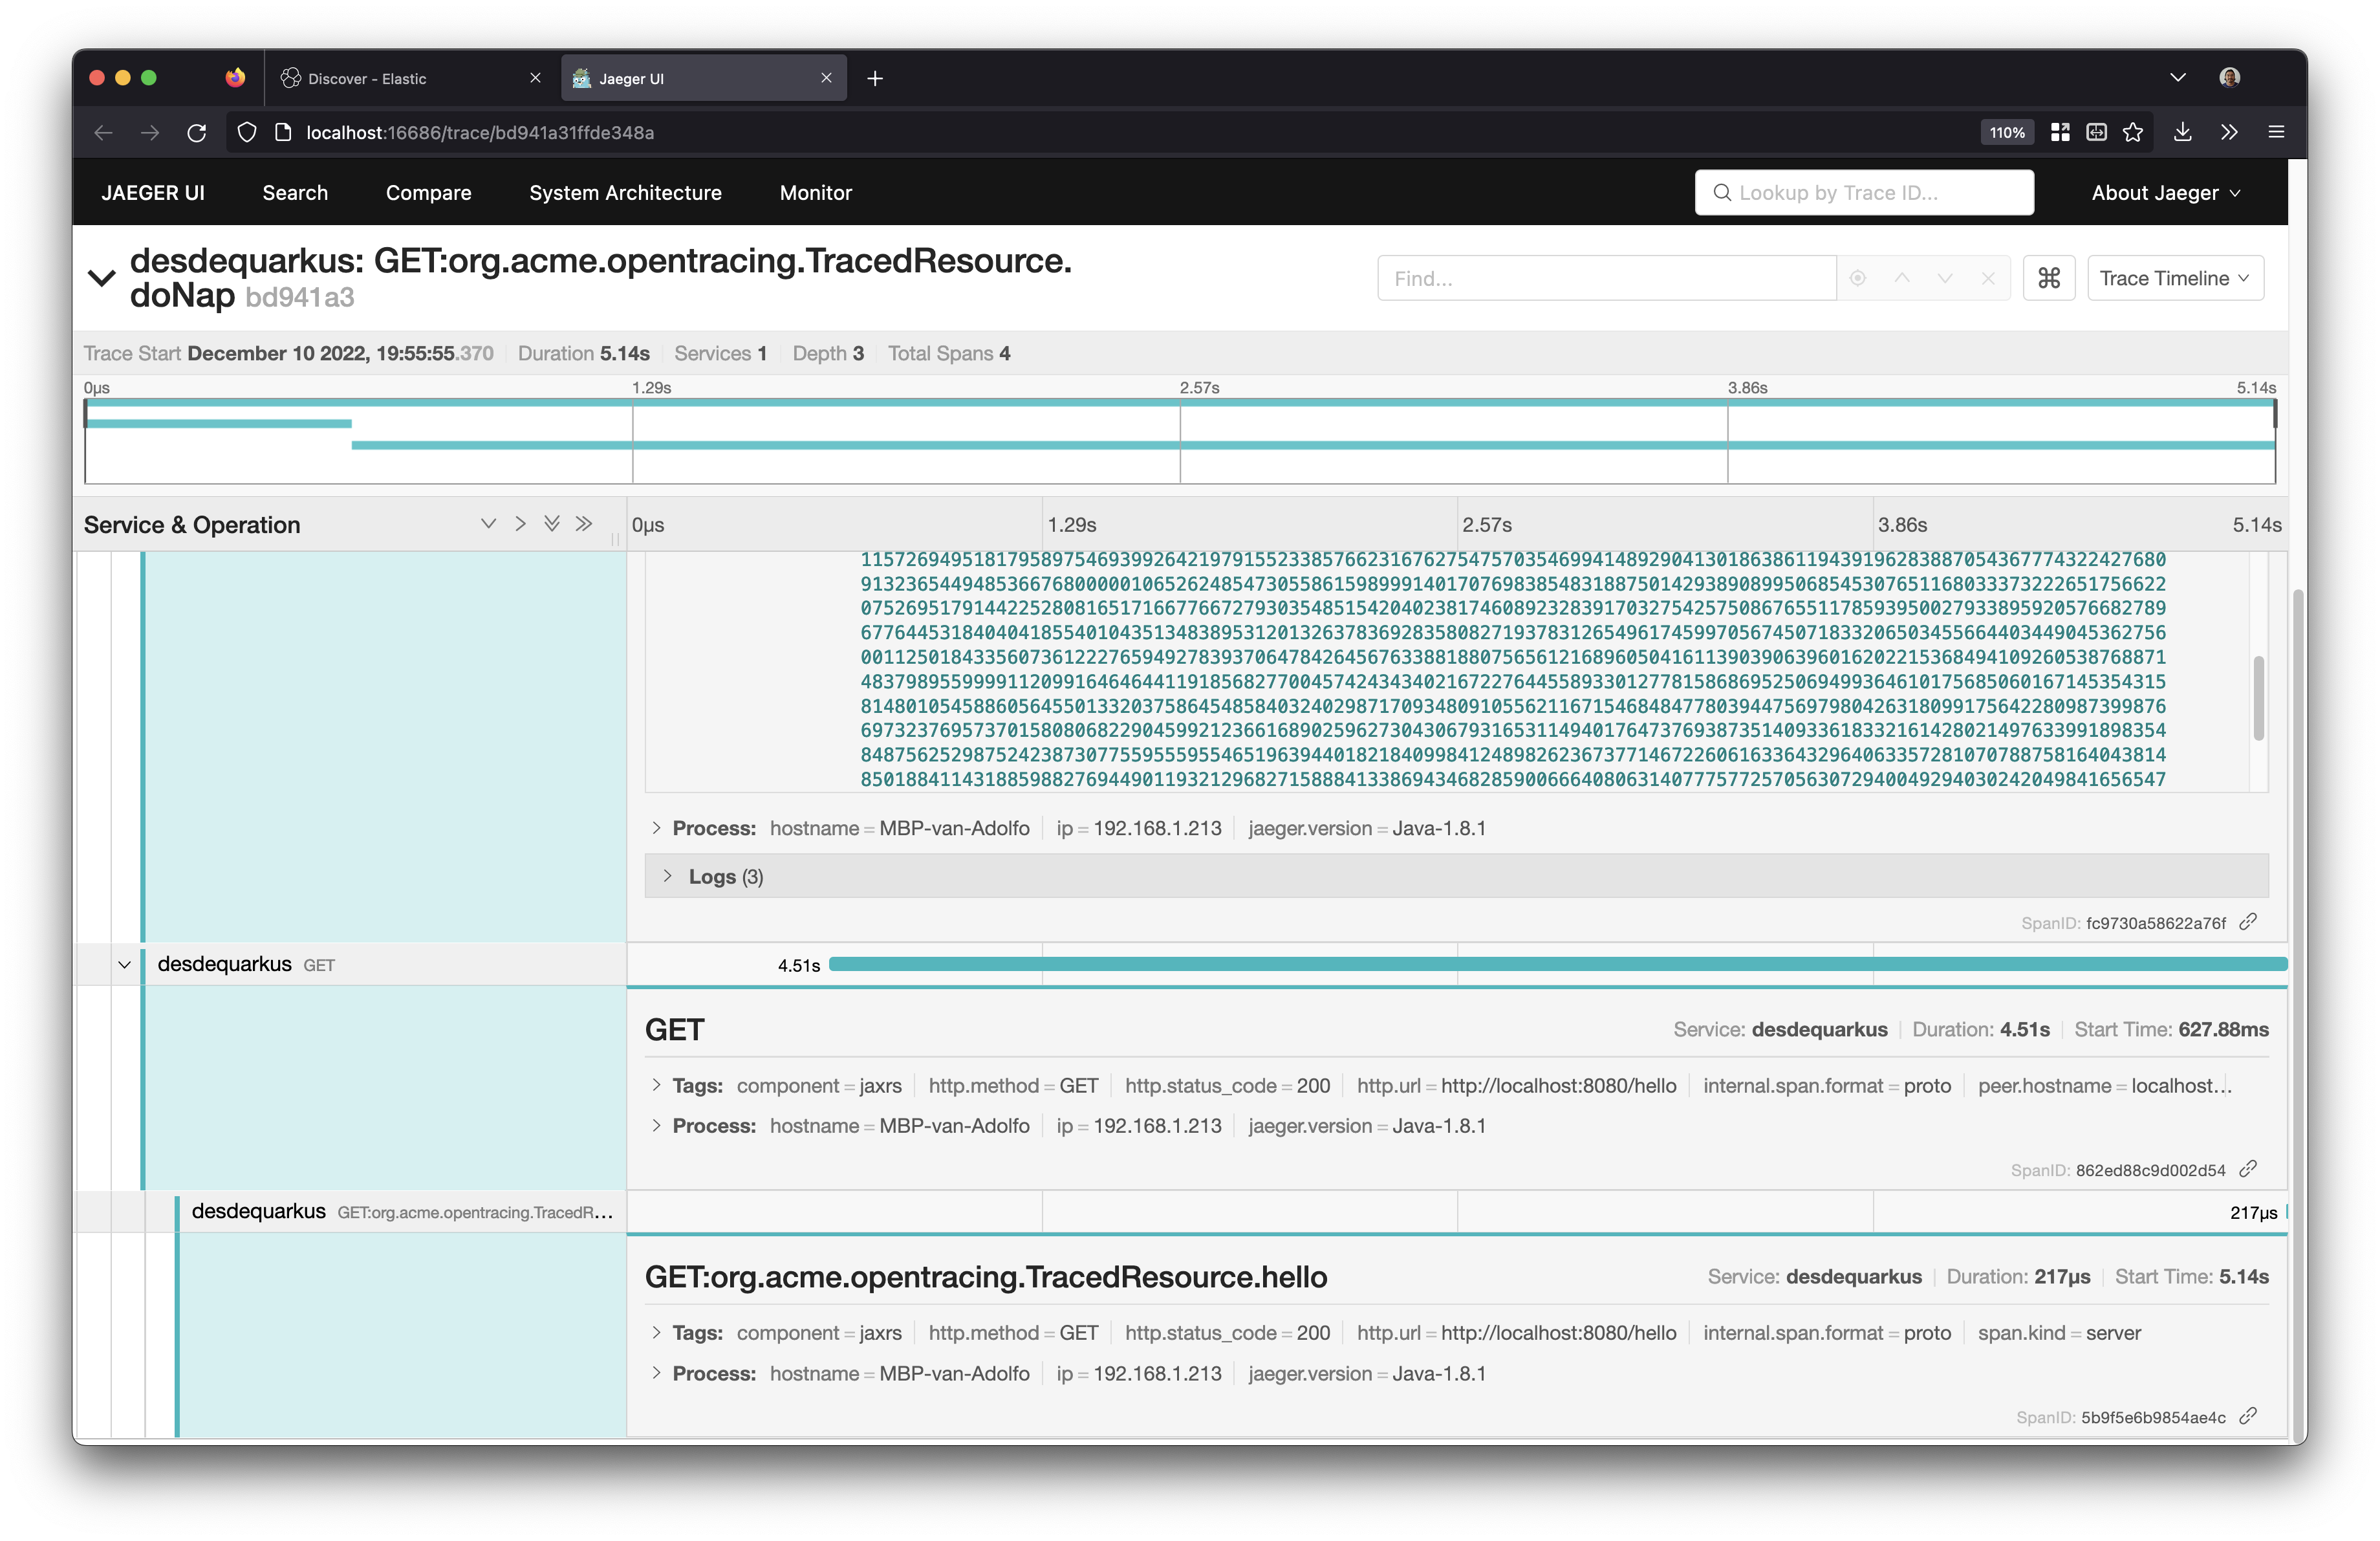
One simple thing we can do in order to make Kibana interoperable with Jaeger is to use the stored traceId as an URL:
Takeaways
As a developer, you should be interested in observability for several reasons. First, observability tools like Jaeger and Elastic APM can help you understand the performance and behavior of your distributed systems at a granular level. This can be invaluable for debugging and optimizing your applications. Second, observability can help you identify potential issues and performance bottlenecks before they become critical. This can save you time and effort by allowing you to proactively address problems instead of reacting to them after they have caused significant damage. Finally, observability can provide valuable insights into the behavior of your users and their interactions with your applications, which can be used to improve the overall user experience. In short, observability is an essential tool for any developer looking to build and maintain high-quality, reliable applications.
Here you can have a unified version with all the required configurations, so you can integrate it on you CI/CD pipeline if necessary. On our next blog we are going to explore this approach in order to make sense of our observability data in kibana, and troubleshooting some possible scenarios on a Quarkus application. Happy o11y!